Archive for the ‘Uncategorized’ Category
I just returned from casting my vote in the ACT election, helping to choose our seventeen representatives. Several of my friends were complaining that this is a lot of politicians for a small jurisdiction like ours with just 256,702 enrolled voters. So how does the ACT compare to other states in terms of number of representatives per elector?
The answer is not too badly. We have around 14,500 electorates per politician in the ACT, compared with 34,000 in New South Wales but just 5,000 in the Northern Territory. We support a similar number of representatives as Western Australia (14,500 per elector) and South Australia (16,000 per elector):
| State | Enrolment (2010) | State / territory politicians (2012) |
Enrolled voters per state politician |
| New South Wales | 4,591,748 | 135 | 34,013 |
| Victoria | 3,547,403 | 128 | 27,714 |
| Queensland | 2,707,464 | 89 | 30,421 |
| Western Australia | 1,356,288 | 95 | 14,277 |
| South Australia | 1,102,827 | 69 | 15,983 |
| Tasmania | 357,873 | 40 | 8,947 |
| Australian Capital Territory | 246,436 | 17 | 14,496 |
| Northern Territory | 120,489 | 25 | 4,820 |
| Australia | 14,030,528 | 598 | 23,462 |
Sources: 2010 enrollment by state courtesy of Antony Green, sizes of state parliaments comes from Wikipedia.
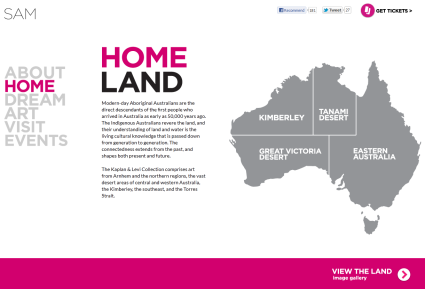
When I saw this map illustrating the Seattle Art Museum’s otherwise excellent Ancestral Modern exhibition words failed me. I guess this is what happens when graphic designers start doing minimalist cartography.
Sometimes ArcGIS just can’t put the labels somewhere sensible, and no amount of Maplex options will help you. Here’s what you do if you want to move them manually.
1) If you want to label all features, it’s best to add them at the start. Right click the layer and select Properties, then Labels, then Placement properties and tick Place overlapping labels.
2) Right click on the layer and select Convert labels to annotations... and choose to Store Annotations In the map.
3) Show the Drawing toolbar, click the Select elements (arrow/cursor tool) and then double-click on the dataframe.
4) Click and drag on the labels.
5) If you didn’t do step one and thus need to add some new labels, select the Label tool on the Drawing toolbar (often hidden behind the New text tool) and click on the feature you want to label.
- Create folder “C:\UserData\markhamf\pgsql” to hold database files
- Extract postgresql binaries from http://www.enterprisedb.com/products/pgbindownload.do to c:\bin\pgsql
- In a cmd.exe console:
- Change to install dir: cd c:\bin\pgsql\bin
- Create new database under user markhamf: initdb.exe -D C:\UserData\markhamf\pgsql
- Start db server under local user account: pg_ctl start -D C:\UserData\markhamf\pgsql
- Install PL/pgsql language into default template: createlang plpgsql template1
- Create PostGIS enabled template: createdb postgistemplate
- Download PostGIS from http://postgis.refractions.net/download/windows/pg84/postgis-pg84-binaries-1.5.1.zip Extract binaries into the existing postgresql directory structure at C:\bin\pgsql
- Return to cmd.exe console in c:\bin\pgsql\bin:
- Install PostGIS functions into postgis template:
psql -d postgistemplate -f ..\share\contrib\postgis-1.5\postgis.sql
psql -d postgistemplate -f ..\share\contrib\postgis-1.5\spatial_ref_sys.sql
psql -d postgistemplate -f ..\share\contrib\postgis-1.5\postgis_comments.sql - Test install was correct: psql -d postgistemplate -c "SELECT postgis_full_version();"
- Create a spatially enabled database from the template: createdb -T postgistemplate gisdb
- Install PostGIS functions into postgis template:
- Test connection with pgAdmin3, and verify that you can connect, and that gisdb is visible. Use the following parameters for a new connection (leave others as default):
Name: gisdb
Host: localhost
Username: markhamf - Add Start Menu shortcuts for:
C:\bin\pgsql\bin\pgAdmin3.exe
C:\bin\pgsql\bin\pg_ctl.exe start -D C:\UserData\markhamf\pgsql - Optionally, addC:\bin\pgsql\bin to the Path environmental variable
Well, I might be a little odd, but I like the charts produced by OpenOffice 3.2 much more than those produce by Microsoft Office 2003. But I like word more than writer, so how to combine the two?
I couldn’t find any instructions online that worked for me. These did though 🙂
Copying and pasting charts from OpenOffice Calc to Microsoft Word is a recipe for disaster. The only effective method I have found is the follow:
- Copy OpenOffice Calc chart
- Open a new document in OpenOffice Draw. Select Edit -> Paste Special -> GDI Metafile
- Right-click on the image, and select Save as Picture…
- Save the picture as a Windows Metafile (*.wmf), not an Enhanced Metafile (*.emf)
- Import into Microsoft Word via Insert Picture -> From File..
- Sigh with relief
The resulting image should be a vector file that word can print in a nice, antialiased way.

